News from the Business Margins Observatory
On November 18, the Business Margins Observatory (OME) was published with data up to the third quarter.
It should be noted that the OME is a joint statistical operation of the Ministry of Economy, Trade and Enterprise, the Bank of Spain and the State Agency for Tax Administration, whose objective is to provide information on business margins to analysts, researchers and any interested citizen, in addition to performing an informative function to clarify what is meant by margins. The OME has its own website which is completed with data published by both the Tax Agency and the Bank of Spain .
Three new developments can be found in the data recently published on the Agency's portal. The first is a new data query application. Until now, all data could be downloaded in Excel format and, within it, the series desired for analysis could be selected. With the new application, the analysis is interactive, modifying data and graphics according to the selection made in the different available menus. The application also allows consultation from mobile devices without loss of quality.

Although the data can also be downloaded from the new application, and in different formats, the files that were published until now are still maintained to facilitate the transition from one presentation to another.
The other two new developments relate to the publication of the statistics for the Annual Corporate Tax Accounts and Income from Economic Activities , in both cases for the year 2022. This information has now been definitively incorporated into the OME data. This is always ahead of the statistics and, in fact, since August it has already incorporated information from 2023, both from the Corporate Tax and from the personal income tax returns of individual entrepreneurs, but the publication of the annual statistics makes the OME data for 2022 definitive.
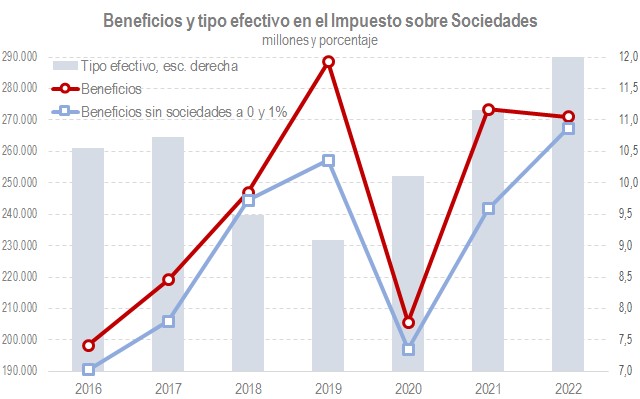
As regards corporate tax accounts, the most striking thing in recent years is the different evolution of profits in companies that pay the general rate and those that pay 0% and 1% tax (mainly collective investment institutions). The chart below shows total profits and profits excluding those companies, together with the effective rate on profits (excluding companies at 0% and 1%), the closest measure of the tax burden on corporate companies.

The chart shows the strong discrepancy between the two series of profits that occurred in 2019 and 2021, indicative of the intense growth in profits in those years in companies with rates at 0% and 1%. The high variability that profits tend to have in these companies makes it advisable to monitor the tax by excluding them from the analysis; Otherwise the result is an erratic average effective rate.
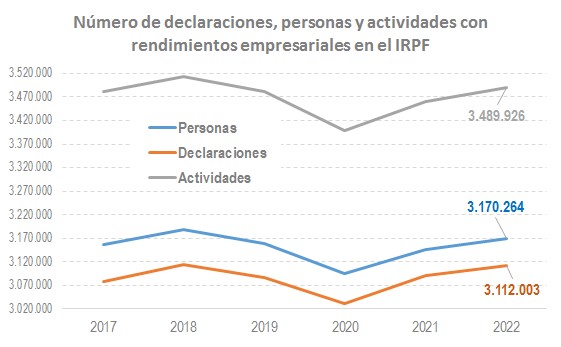
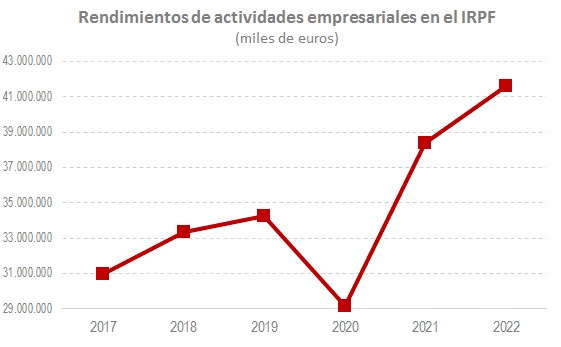
As for the results of personal companies, information that is also included in the OME as a complement to the information on companies, in 2022 the trend that was already seen in 2021 has been confirmed and which can be summarized by saying that, although the number of people and declarations has not reached the maximum reached in 2018, the amount of income in 2021 and 2022 far exceeded pre-pandemic levels. The following two graphs show this evolution.

