The April 28 blackout in daily sales
Since the entry into force of the system of Immediate Provision of Information (SII) in July 2017 there is daily sales data, so that the available economic information is closer to the time of the activity. We no longer have to wait for monthly or quarterly data to get an idea of what's happening in the economy.
This information is also very general in nature because, although there are around 70,000 companies that must complete their tax obligations through the SII (representing 75% of total sales of all VAT payers), the information on invoices issued and received collected in the system also allows for the development of leading sales indicators for broader groups. This is the case of Domestic Sales Advancement in Large Companies and SMEs. This operation includes both invoice issuers and recipients (who are the SII's taxpayers) and their counterparts (who are other companies and end consumers). With this information, indicators are built with data from more than 1.2 million companies, that is, all of the statistical declarants. Sales, Employment and Salaries in Large Companies and SMEs, which has the greatest coverage of the national statistical panorama.
Given this wealth of near-real-time information available, it's no surprise that, in the face of extraordinary events like the April 28 blackout, daily data is used to provide an urgent estimate of the potential economic impacts. It was already warned in another entry of this newsletter, following the catastrophe caused by the DANA in Valencia, of the difficulties that this type of exercise entails and, above all, of the discretion to which these assessments are subject. But, in addition, both in that case and in the case of the blackout, the characteristics of the SII's daily series and the schedule for data availability must be taken into account.
The following graphs are useful to explain these two aspects. The first two are based on information published on Wednesday, May 14. The first of these shows the daily billing for Group D of the National Classification of Economic Activities (CNAE), which includes companies that supply electricity, gas, steam, and air conditioning. The second includes the billing for the rest of the activities. Both have daily data for March and April and are marked on Mondays (blue circle) and Tuesdays (green square).
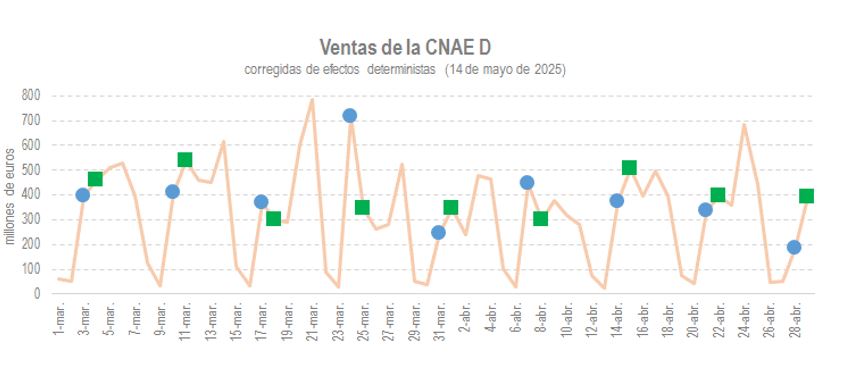
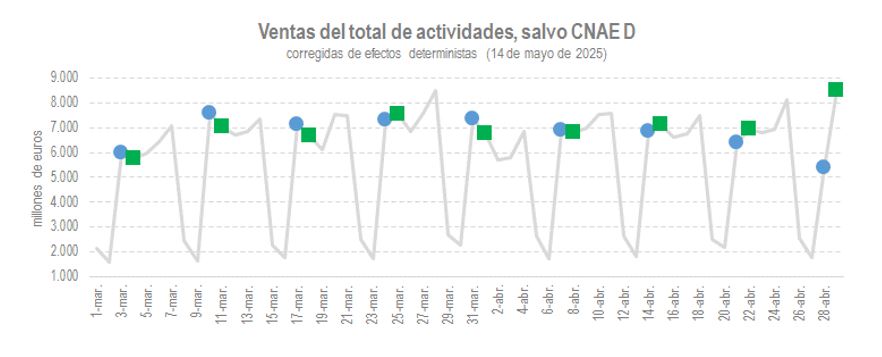
The impact of the blackout can be seen in the two graphs. The impact seems smaller than one might think at first. In the case of sales in the electricity supply sector, the series is more irregular, and it is more difficult to determine how atypical the results of Monday, April 28, were. This is not the case for other activities, where a certain stability in billing is observed for each day of the week, which is broken on the day of the blackout.
Why isn't the impact of the blackout, particularly on the electricity supply, clearer? The reason is that the figures refer to the turnover for each day of the week, not necessarily to what happened on that day. In this regard, it must be taken into account that electricity consumption billing is done with a delay compared to physical consumption. Therefore, the impact will likely also be felt on dates following the actual day of the blackout. It should be noted that one of the characteristics of these daily sales series is the accumulation of billing on the last day of the month (hence the need to correct the series for these deterministic effects, as is done in the graphs presented) and that, therefore, the impact of the blackout is also on that last day.
On the other hand, note that the data for April 29 is also abnormal compared to previous Tuesdays, especially in the rest of the activities. The figure was higher than usual. This fact is important when assessing the impact, as part of what was lost on Monday the 28th was recovered the following day. And this is linked to the schedule for data availability and subsequent updates.
In this regard, several aspects must be emphasized. Sales information for April 28 was released on Wednesday, May 14. Why this delay? Indeed, the SII generally requires taxpayers included in the system to send the details of their billing records to the Tax Agency within four days of the invoice being issued. However, experience shows that for various reasons (including some peculiarities of the SII itself) the information received takes time to be completed. Therefore, from the outset of data publication, it was established that, although the series were published daily, the report and accompanying database would be published weekly, and that the reference date for the data would be two weeks prior to publication. This ensures that the published figures would not be drastically revised, that the revision would not entail such a change that the diagnosis that could have been made with provisional data would be completely erroneous.
This point about updates, linked to the need not to rush into assessing the impact of a specific event, can be seen by comparing the previous graphs with the following two, which show the same series, but updated a week later.
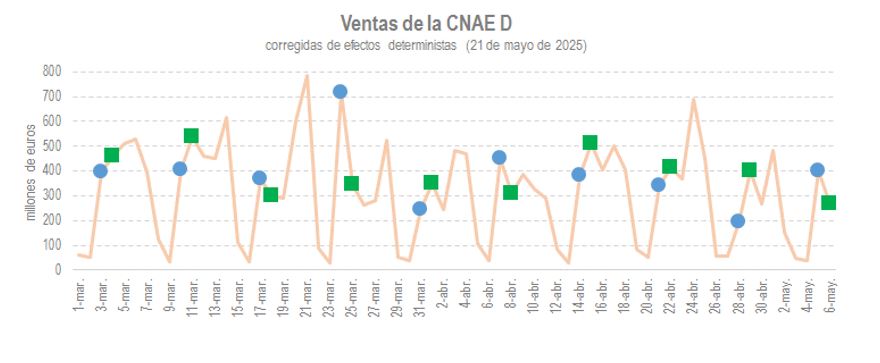
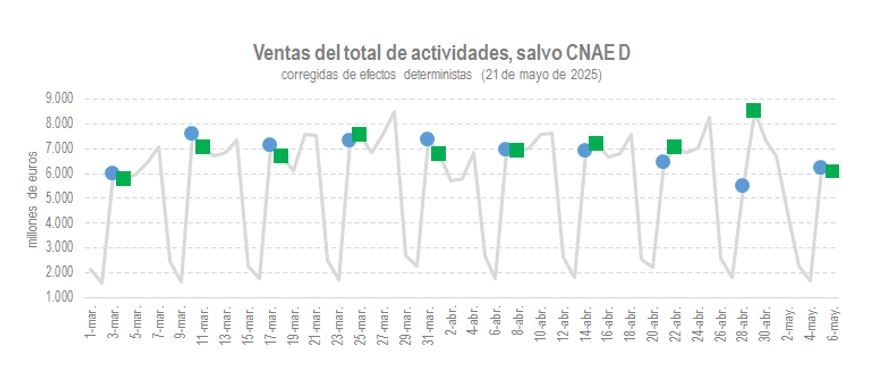
As can be seen, the figures for April 28 and 29 are slightly higher than those from the previous week, but the data from the following week also allow for a more refined hypothesis of what those days would have been like if there had been no blackout, a hypothesis that is essential for estimating the impact.