First data on the financial results of companies in 2024
On July 25, the deadline for filing annual corporate tax returns for the 2024 fiscal year ended for companies whose fiscal year coincides with the calendar year. More than 95% of all filers are in this situation, which would suggest that the figures known at this point would be sufficient to give an idea of what happened this year. However, the existence of some significant groups with other fiscal years and the irregularity of the series themselves prevents this. To get a complete picture of the fiscal year's results, we must wait almost a year, until all companies have filed their tax returns. This is the reason why in the statistics that have this statement as a source (among others, Consolidated annual accounts, Unconsolidated annual accounts and Statistics by items) only data referring to 2022 will be counted until next October.
However, not having all the closed information for a fiscal year doesn't mean that the data isn't used as it becomes available, something that's especially necessary in a case like corporate tax, whose behavior is often difficult to understand. Thus, for example, in the Annual Tax Collection Report, published in April, already made a provisional estimate of the main variables for the 2023 financial year (see Tables 3.1, 8.4 and 8.5) and even a first preview of some of them for 2024. As seen, at the time of publication of this report, the universe of taxpayers is not complete, but very few companies have yet to file their T-2 tax return.
Recently filed returns, those for 2024, also benefit immediately. He does it Business Margins Observatory (OME). In its latest edition, published on August 18, information on the variables that give rise to gross operating profit has been incorporated. This is a subset of companies (those that simultaneously file VAT, withholding, and corporate tax returns), but whose performance is very similar to that of non-financial companies as a whole. To avoid problems caused by the different filing dates of the declarations, the constant population rate is used as an approximation (the variation of the variables in the companies that file declarations in years T and T+1; in this last year, those who filed a return in 2023 and have done so in 2024). This procedure is the same as that used in other longer-standing fiscal statistics, such as the report of Sales, Employment and Salaries in Large Companies, in which we must also address the problem generated by a population of taxpayers who respond to administrative rather than economic criteria.
The result of all these approximations can be seen in the following table:
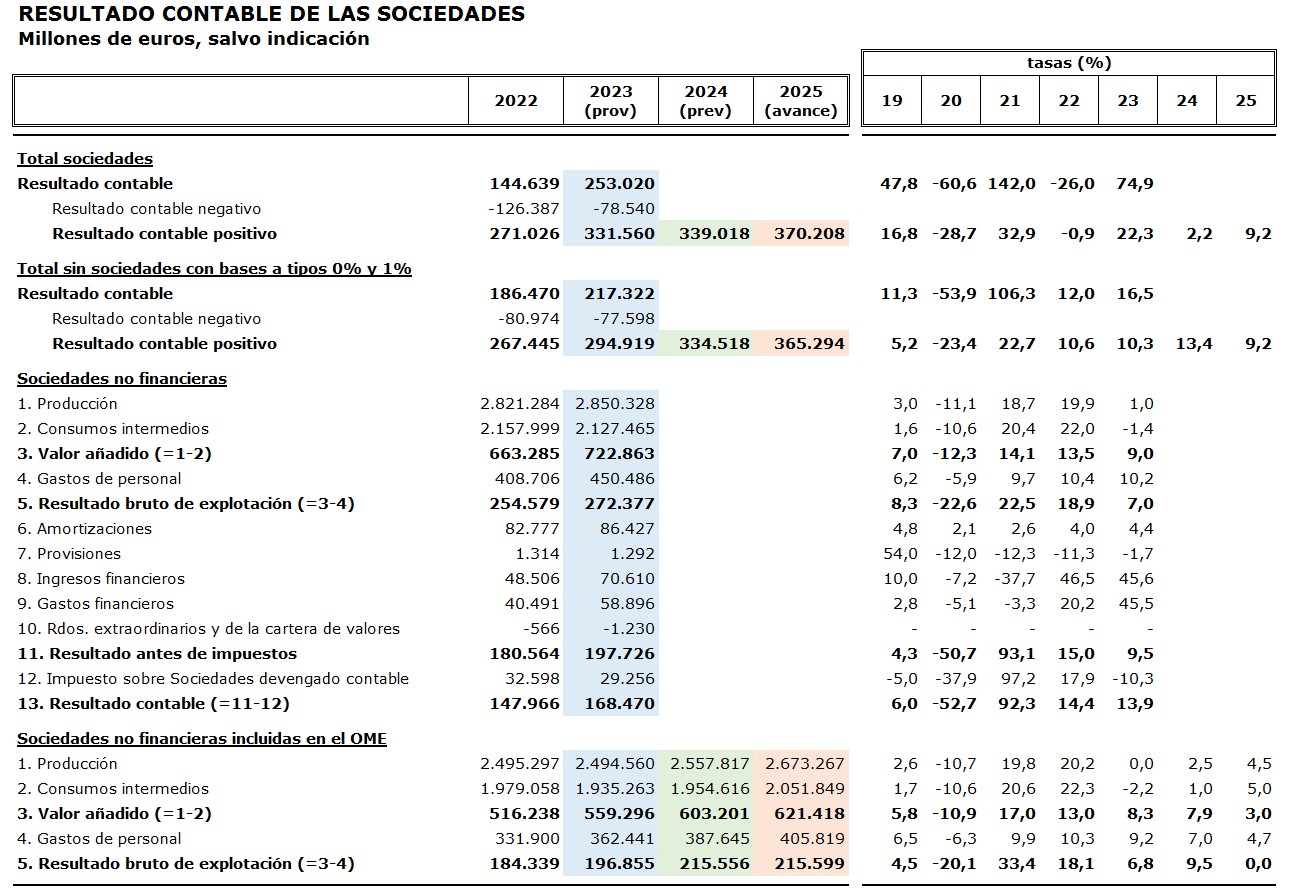
The table shows provisional figures for 2023 in blue, which can be found in the Annual Tax Collection Report. Data forecast for 2024 is shaded in green. Of these data, in the upper part of the table, the positive accounting result is the one included in the file of Historical series of bases, rates and accrued taxes It is published quarterly along with the monthly revenue report (the next one will be released on September 12) and is used to monitor the collection of Corporate Tax. Below, also in green, are the operating accounts of the non-financial companies included in the OME. These figures are obtained, as stated, from the constant population rates of the 2024 tax returns already filed. It can be seen how in 2022 and 2023 the rates of variation of the gross operating profit in the OME (18.1% and 6.8%) were very close to those of the total of non-financial companies (18.9% and 7%), which indicates that the estimate for 2024 with the rate at constant population is a good approximation of what the gross operating profit will finally be when, in a while, the complete information is available. Growth in 2024 would be 9.5%, which would mean that operating profit in that year would be more than 57% higher than that recorded in 2021.
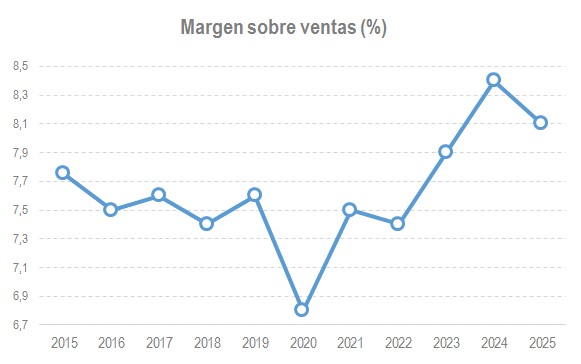
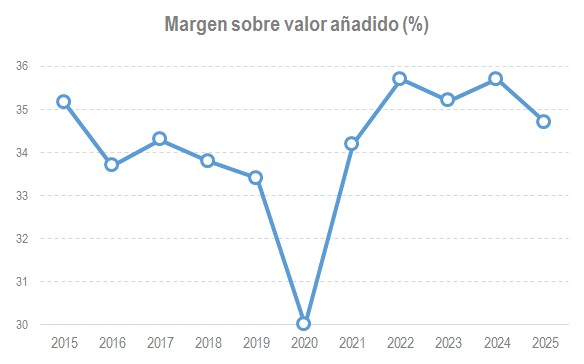
Finally, the table, in orange, includes the 2025 preview data estimated from information available from VAT and labor withholding declarations. The declarations for the first half of the year are available (the declarations for June and the second quarter were submitted in July). The new development in these data is the stabilization of operating results after, as we have seen, several years of strong increases. With this, it appears that 2024 will mark a peak in the upward cycle that margins have shown in recent years. However, margin levels would still be higher than those observed before the pandemic. The following graphs illustrate this conclusion.