Recent tax information on SMEs
The Statistics on SMEs, both incorporated and non-corporate with the provisional data corresponding to 2024. This publication is the most detailed analysis available of this type of company, the most numerous in the business landscape.
Statistics analyze the world of SMEs from the point of view of two groups: On the one hand, there are personal businesses (or, more popularly, self-employed individuals) that declare their income in the Personal Income Tax (IRPF) under the direct estimation method, and, on the other hand, there are small businesses that declare in the Corporate Income Tax. In the terms used in statistics, the former are non-corporate SMEs and the latter are corporate SMEs.
These two groups are also the subject of analysis in other statistics. In the case of personal businesses, the Statistics on the Returns of Economic Activities It allows for a detailed analysis of the economic activity of these companies and of the rest of the individuals with business income who declare it in other ways, such as objective estimation, which is particularly important in the agricultural sector. In the case of corporate SMEs, more information can be found in the Annual accounts for Corporation Tax, where they appear with the rest of the business fabric of that tax. Both types of companies are part of the universe of companies analyzed in the Business Margin Observatory which also offers updated information on a quarterly basis. The virtue of statistics exclusively for SMEs is the possibility of comparing between groups that are, in principle, similar in both number and characteristics.
Indeed, the number of companies of one type or the other is similar. In 2024, the statistics study a total of 1,892,445 SMEs, of which 932,445 are non-corporate and 960,000 are corporate. The sectoral structure also shows similarities, as can be seen in the following graph (referring, as in the rest of the graphs, unless otherwise indicated, to the year 2024):
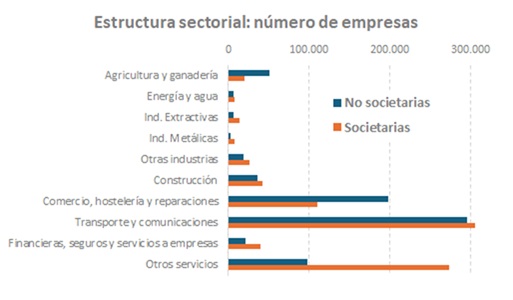
The biggest differences are seen in the trade sector (with a greater presence of personal businesses) and in other services (where the opposite occurs). In agriculture and livestock farming there is also a greater weight of the self-employed and the difference would become overwhelming if the farmers who declare in objective estimation (about 800 thousand) were included.
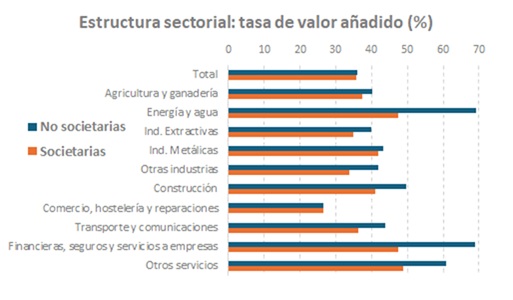
When analyzing the activity in the two groups of companies, similarities can also be found in some relevant points. For example, the value-added rate (measured as the ratio between value added and production) is practically the same at the aggregate level, although at the sectoral level significant differences are detected in some branches of activity. The following graph illustrates this point.
The major differences between corporate and non-corporate SMEs begin to be seen when the labor factor comes into play, which is almost the same as saying that the differences become apparent when the size of the company appears. The following graph compares the percentage that personnel expenses represent in different SMEs.
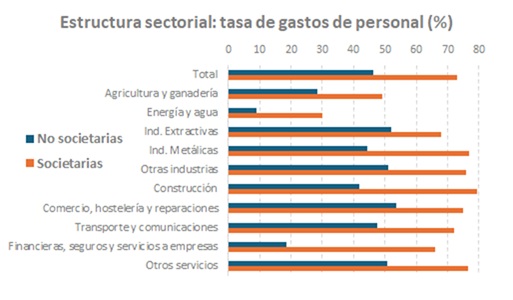
In the graph, the importance of personnel expenses is measured in relation to the added value generated in production. In other words, the rate indicates how much of that added value corresponds to the labor factor (wages, contributions and other similar concepts). As can be seen, the weight of this factor in corporate SMEs is much greater than in non-corporate SMEs. Related to this is the gross operating margin (the part of the value added that remunerates the capital factor, divided by production), which is higher in smaller companies than in large ones:
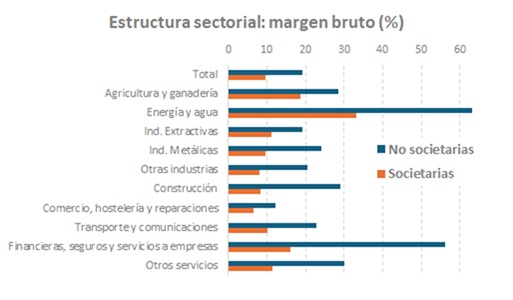
This result is often surprising when this type of data is first seen because it tends to identify greater profits with larger companies. But the margin doesn't measure that exactly, but rather the profit per unit produced. The difference in margins between non-corporate and corporate SMEs indicates the different way of producing and generating profits, something that depends on the scale of production of the companies: On a smaller scale, a larger margin is needed to survive. It should not be forgotten that the profits obtained by sole proprietorships are, in reality, their income, which is not necessarily the case in corporate SMEs.
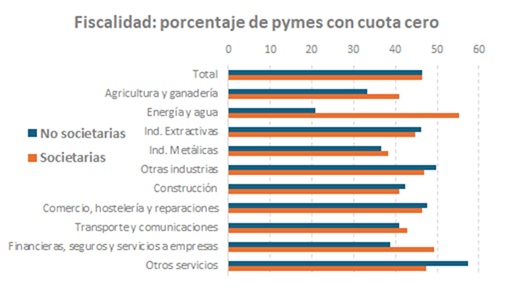
It is also interesting in this comparison to see what the burden of taxation is on each of the groups. Again, some similarities can be observed, such as the number of SMEs that have a zero quota, almost half of them in both cases. Except in some sectors, the behavior is very similar in all of them:
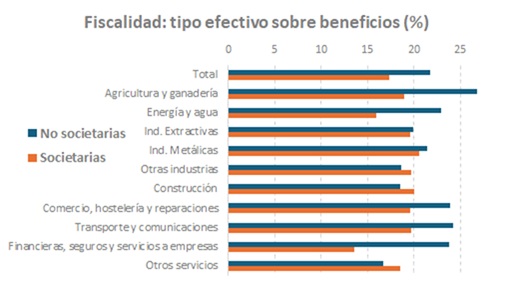
Where differences are noticeable is in the effective tax rate on profits, which is generally higher for non-corporate SMEs:
It wasn't always like this. If we analyze the evolution of some variables since 2017 (the first year of the statistics), we observe significant changes, at least in two of them, such as the margin and the effective rate. This evolution can be seen in the last graph:
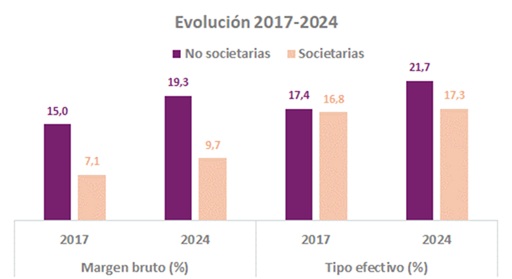
Gross margin increased between 2017 and 2024 in both groups, following the same trend as other indicators (such as those used in the Business Margin Observatory) in which a clear change can be seen between the period before the pandemic and the period after. Regarding the effective rate, the discrepancy that occurs between some SMEs and others in 2024, which was not noticeable in 2027, is related, among other factors, to the different form of taxation, with a progressive scale in non-corporate SMEs and with a proportional rate in corporate SMEs.