Information on personal companies in tax statistics
Within the set of information that forms the tax statistics covering the most varied aspects, personal companies (the self-employed) can be analyzed in great detail through the statistics of Income from economic activities . This publication takes advantage of the information that these entrepreneurs provide in their annual Personal Income Tax returns. The economic and tax information contained in the declaration, together with your personal characteristics, provides a complete overview of this type of company. The latest published information corresponds to the 2021 financial year (the next publication is scheduled for November of this year 2024).
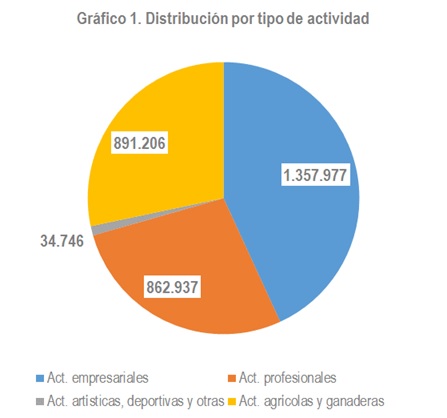
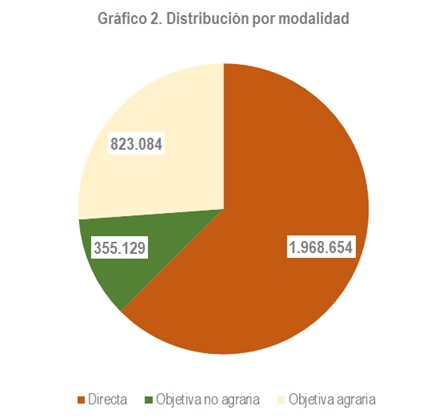
As in all cases where the group analysed is very large (in 2021 the number of personal companies was 3.15 million), the first thing to take into account is its diversity, which manifests itself in very different ways. Charts 1 and 2 show the different groups that are included in this collective, either by the type of activity (Chart 1) or by the way they determine their income in the personal income tax return (Chart 2).
Although perhaps where the disparity is most evident is in the unequal amount of returns from the various activities. Figure 3 illustrates this point by comparing some of the activities in direct estimation. As you can see, when we talk about personal companies we are talking at the same time about registrars or notaries with earnings of more than 300,000 euros and professionals dedicated to cleaning services or dancing who barely exceed 6,000 euros per year.
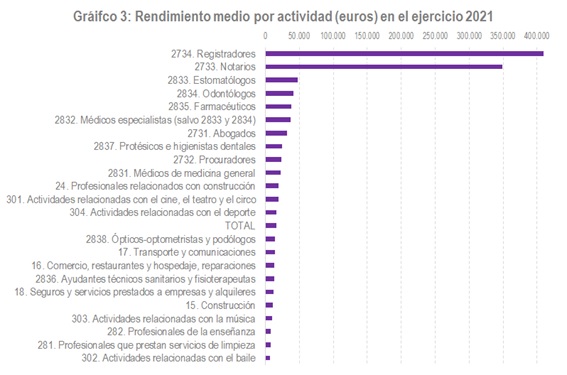
In tax origin statistics, it must always be taken into account that average amounts, such as those shown in the graph above, may have the problem of including within the population people who are only partially dedicated to the activity; In the previous case, taxpayers whose relationship with business or professional activities is marginal. This fact causes the averages to be low compared to what would be expected a priori. This circumstance is clearly seen when analyzing the distribution of entrepreneurs by income brackets, as is done in Chart 4, which shows this distribution in three different years to see its shape, its evolution, its stability over time and its main measures (median, mean, decile 9).
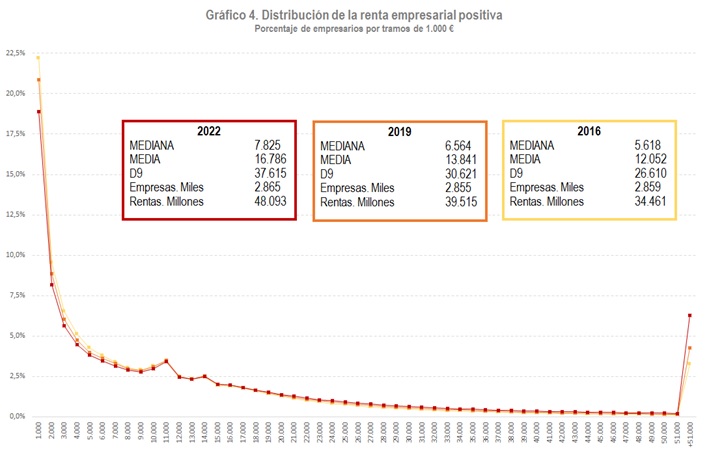
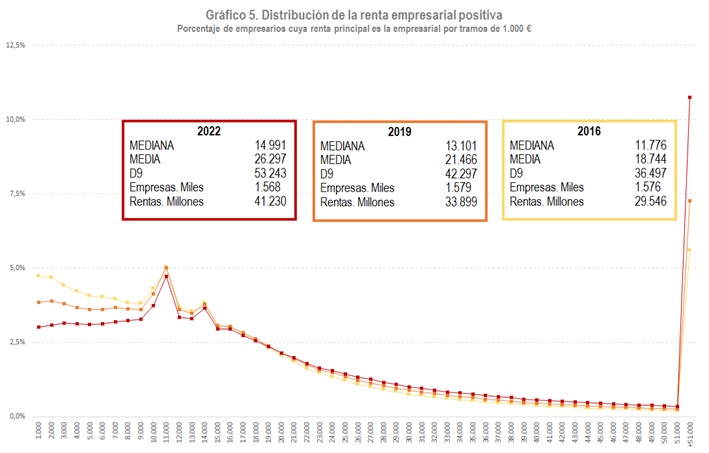
As in other well-known cases (such as the wage distribution based on tax sources), the distribution has a very large lower bracket, which indicates the existence of people for whom business income is not the main source of income. In this regard, it should not be forgotten that, as can be seen from the statistics, around 30% of the total income of these individual entrepreneurs comes from salaries. If the distribution is restricted to only those taxpayers whose business income is more than half of their total income, the picture changes substantially (Chart 5).
The current monitoring of the main group of these companies, those that declare according to direct estimates, can be done quarterly with the information provided by the Business Margins Observatory (discussed in several previous newsletter entries).
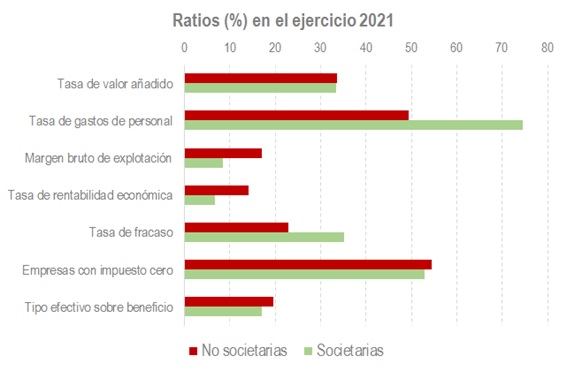
Finally, if what you want is to put these companies in context by comparing them with similar companies with a corporate form, you can go to the Statistics of corporate and non-corporate SMEs which analyzes jointly, from the year 2017, non-corporate SMEs in direct estimation and small corporate companies. An example of the results that can be consulted in this publication are those collected in Chart 6.