The new edition of the municipal income statistics
The publication at the end of June of the Statistics of Personal Income Tax filers is the starting point of a series of publications related to this declaration (in this entry The newsletter displays the entire constellation of statistics derived from this model).
From the point of view of information linked to the territory, the statistics of the declarants show the data only at the national and regional level; In fact, it should be thought of as 16 statistics (the national one and the 15 statistics of the Autonomous Communities of the Common Tax Regime). But a few months after its publication, information with a municipal breakdown was also made available (Statistics of Personal Income Tax filers by municipality) and sub-municipal (Statistics of personal income tax ( Personal Income Tax) filers by municipality, from the largest municipalities by postal code).
The wealth of data offered by these statistics allows for multiple analyses, both cross-sectional and over time (the series begins in 2013), but, if the main results had to be summarized in two elements, they would be the following: the persistence of cities with higher and lower incomes, and the different patterns of incomes according to the size of the municipality. The 2023 edition of municipal statistics confirms these two features.
Regarding the first one, last year already (see here) showed the evolution of the six cities with the highest and lowest income since 2013, noting that several of those six municipalities had remained at the top or bottom of the ranking in those years. In 2023 the situation is similar, as can be seen in the following table.
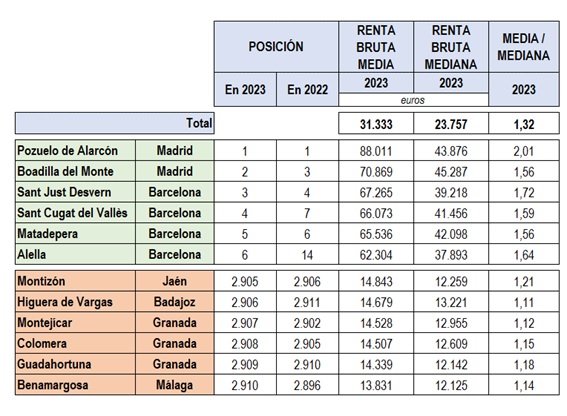
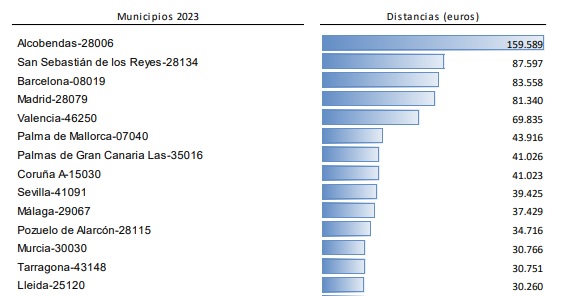
The distance between them can also be calculated in the table. The average income of the first six is around 70,000 euros, while in the last six it does not reach 14,500. That gap narrows if you consider the median income (the income that leaves half of the municipality's population above and the other half below). The mean/median ratio is a measure of the inequality of income distribution within each municipality, and logically, it is larger the higher the income. The following graph (here(You can consult the details) shows the municipalities where the greatest inequalities between postal codes are found within the same locality.
The phenomenon of persistence in the ranking can also be seen by analyzing the distance between the municipality with the highest and lowest income and the total average income over time. This is what is done in the two graphs shown below.
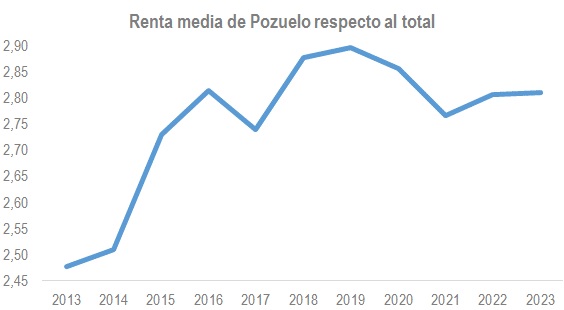
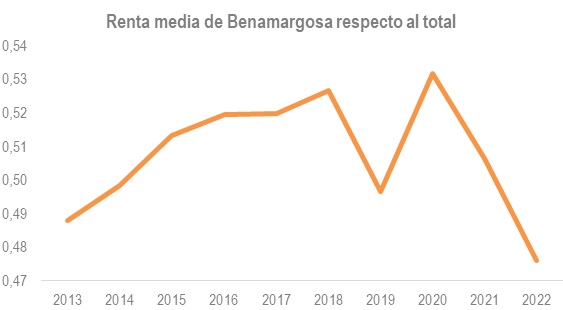
The first graph corresponds to Pozuelo, which only lost its first position in the ranking in 2018. Since 2016, their average income is around 2.8 times the total average income. The second graph reflects the situation over time of Benamargosa, which in 2023 was the municipality in last position. A certain stability can also be observed around 0.5, that is, in the last 11 years the average income in Benamargosa has been approximately half that of the group of municipalities.
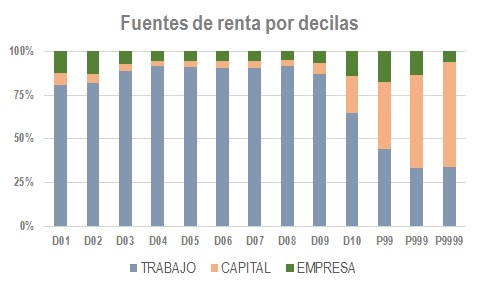
The second element that summarizes the results of these statistics is the different composition of their incomes. The following graph shows the distribution of gross income according to the different sources of income (labor, capital and business) by the size of the municipality.
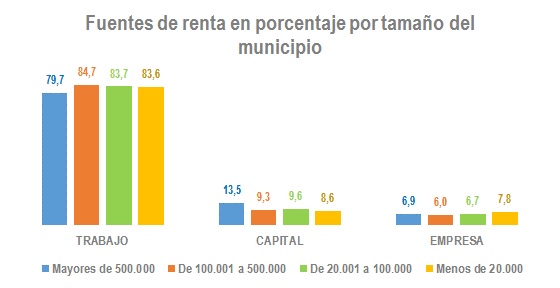
The accumulation of capital income (movable, immovable and capital gains) is particularly noteworthy in the six cities with more than 500,000 inhabitants, something that It was already pointed out last yearwhen commenting on the results of the six cities with the highest income, highlighting how this accumulation of capital income had been increasing over the years. This different pattern between municipalities is simply another way of looking at a phenomenon observed when analyzing the decile distribution of Personal Income Tax filers. This distribution can be analyzed using the data contained in the file. IRPF Distributions that is offered with the Annual Tax Revenue Report. The results for the 2023 fiscal year are shown in this last chart.