The evolution of business results in 2021 and 2022 according to tax information
A few months ago this
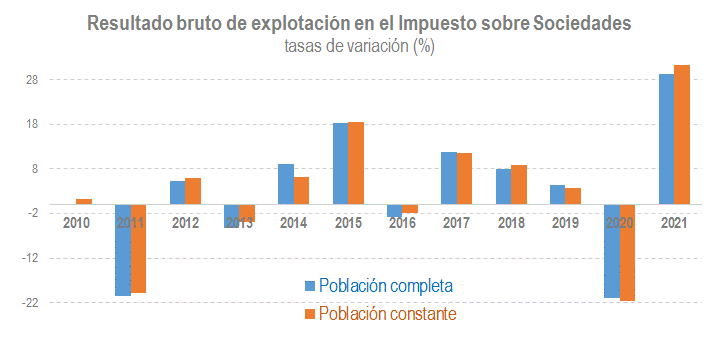
The publication of the Business Margins Observatory in August brought with it the novelty of the dissemination of the first data on the accounting of companies for the 2022 financial year. It should be noted that companies whose fiscal year coincides with the calendar year have until July 25 to submit their corporate tax return, which includes, among the information required for its completion, the profit and loss account from which the gross operating profit is deducted. Since the universe of companies for Corporate Tax is not closed until well into the following year (due to the existence of different fiscal years), the information provided by the Observatory at this point for the year 2022 is offered in terms of constant population (the set of companies that filed declarations in both 2021 and 2022). Historically, the difference between the results of this constant population and those finally observed has been small (as illustrated in the following graph), so that, even without having all the information on the tax, the approximation is sufficiently good.
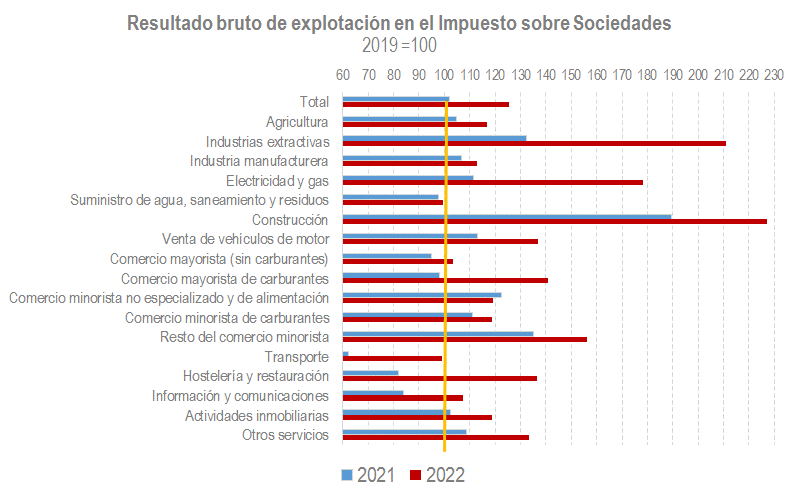
The information available for 2022 shows that in practically all sectors the gross operating profit in 2022 exceeded that obtained in 2019, even in those activities that were still in difficulty in 2021. The following graph summarizes these results.
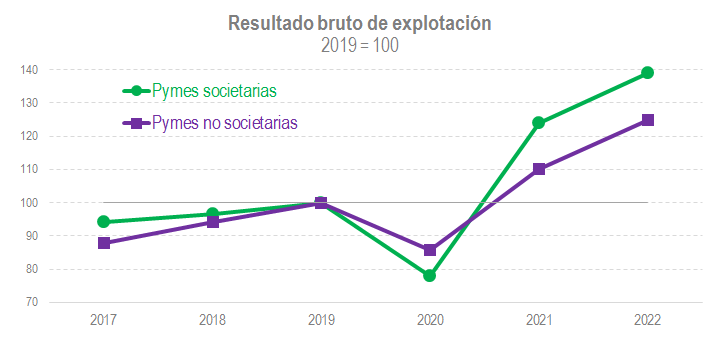
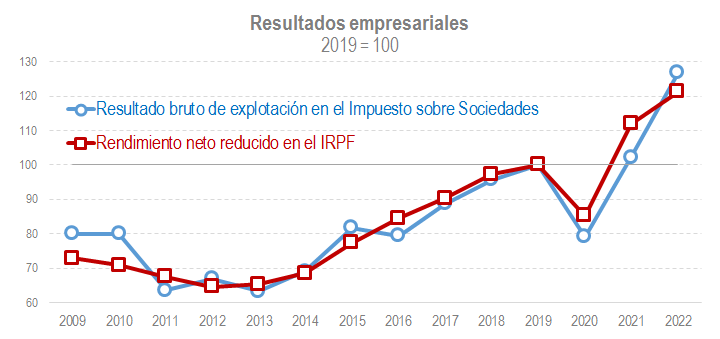
This is true for companies, but what has happened in recent years in personal and professional businesses? The statistics were recently published Income from economic activities that exploits the information contained in the declaration of the PIT relating to the activity of self-employed workers and professionals. The publication provides detailed knowledge of these companies (territorial distribution, gender and other personal characteristics, importance of business income in relation to the rest of their income, etc.), but also gives the possibility of analysing the evolution over time of the most important variables. The main conclusion of the 2021 edition, which has now been published, is that, although the number of taxpayers did not fully recover after 2020, income clearly did. If these results are analysed together with those of the Observatory, it can also be verified (see graph below) the coherence shown by the results in both sources (in economic activities, the year 2022 is estimated with the provisional data of the file of bases, rates and taxes accrued that accompanies the Monthly Tax Collection Report ).
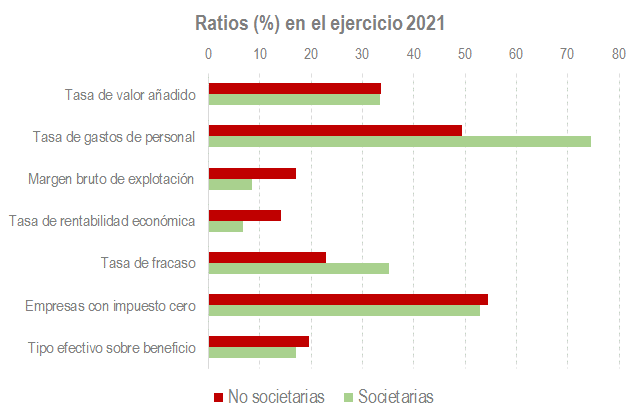
Finally, two weeks ago the Statistics of corporate and non-corporate SMEs was published, which jointly analyzes two groups of companies: Non-corporate SMEs that declare in normal and simplified direct estimation in the PIT, and small-sized companies that do so in the Corporate Tax. It is, as can be seen, a subset of the companies included in the two sources seen above. The idea behind this statistic is to analyse a group that is as homogeneous as possible (in terms of activities, availability of information, etc.), so that differences between them can be detected. The results confirm the patterns already observed in previous editions, while once again demonstrating the improvement in profits experienced since 2020.
