Monitoring the impact of gasoline price increases on fiscal statistics
In the current statistics obtained from the most up-to-date fiscal information, the report Daily Inside Sales FlashFrom the first data in March, a change in trend was observed.
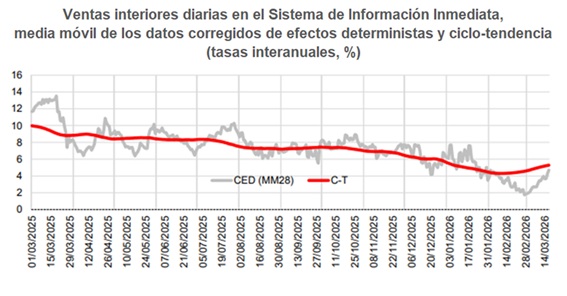
One of the advantages of the Flash report is having an extra week of information compared to the previous report. Daily saleswhich, in return, has a breakdown by activities. In either case, the daily figures are always in euros, without deflation, which makes it impossible to discern to what extent the change seen since the beginning of March was due to an increase in activity or only to a price effect, although the coincidence with the increase noted in gasoline and diesel suggests that the latter is the most relevant. In any case, uncertainty remains as to what the impacts on the rest of the economy might be. Will the price increase continue for some time? How will its effect spread across different sectors of activity? Can tax statistics shed any light on these matters?
Unfortunately, the current situation of uncertainty is similar to that experienced at the end of February 2022 with the invasion of Ukraine. How did that translate into the companies' sales and purchase records?
The following graphs give an idea. The first one shows the daily evolution of sales in the retail trade of automotive fuels. The second one shows the rate of that series along with that of total domestic sales.
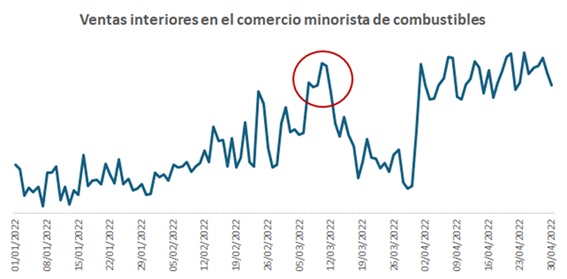
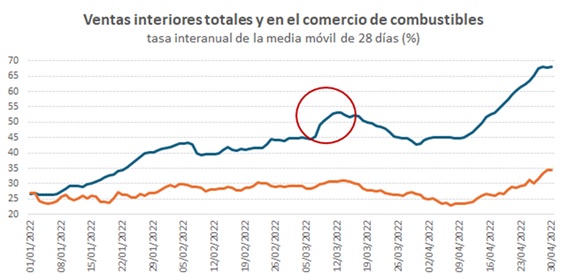
Both graphs indicate the dates on which there is an increase in the weeks following the start of the conflict. In the case of retail fuel sales, a rebound is observed in those weeks and a moderation in the following weeks. It is not until April has already begun that the process seems to stabilize at levels much higher than those at the beginning of 2022. In total sales the first impact is very slight, but from April onwards sales across all activities also follow an expansive trajectory.
As mentioned, the figures are always in nominal terms. Deflation can only be done with external price information. Only in some cases can an approximation be made with one's own information, and never in periods of less than one month. This is the case with hydrocarbons, for which there is, on the one hand, information on the price of imports of petroleum products that can be found in the Foreign Trade StatisticsAnd, on the other hand, an indicator of the implicit price of domestic hydrocarbon sales can be constructed by combining the sales information from the refining sector provided in the monthly report of Sales, Employment and Salaries in Large Companiesand the hydrocarbon consumption figures published in the quarterly report of Historical series of bases, rates and accrued taxesaccompanying the Monthly Tax Collection Report. The result is shown in the following graph:
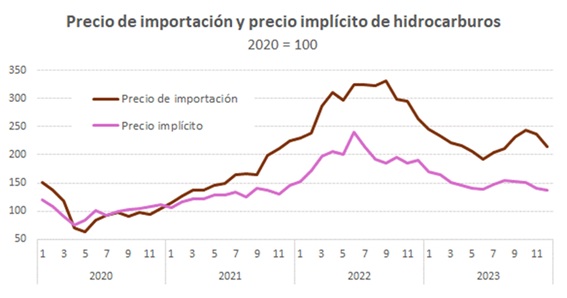
The price increase was immediately noticeable, although it peaked in the following months and remained at a very high level until the end of 2022 and more moderate, although still high compared to the previous situation, in 2023.
The extent of the effect of the rise in gasoline and diesel prices on the economy as a whole can be tracked using the rest of the cyclical and structural statistics. On a monthly basis, the impact of the increased costs resulting from these types of price increases can be analyzed by examining the evolution of domestic sales of intermediate goods and services in the report. Sales, Employment and Salaries in Large Companies. Between 2020 and 2023, these sales behaved as shown in the following graph:
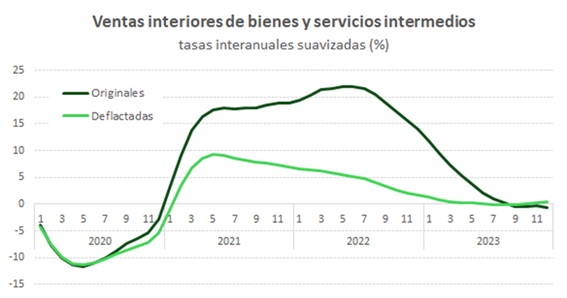
The increase in costs in companies had already been noted with the exit from the pandemic (even as early as 2019), but in 2022 this process intensified particularly from the start of the war conflict.
The monitoring is completed with the information contained in the quarterly statistics of Sales, Employment and Salaries in Large Companies and SMEswhere you can find not only sales, but also purchases from more than 1 million companies.
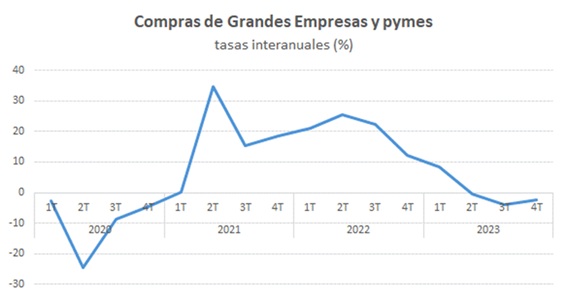
Logically, since the data is quarterly, the effects are more diffuse, but an acceleration in the growth of purchases is still detected in the second quarter of 2022. That same upturn, and with greater intensity, was also noticeable in sales:
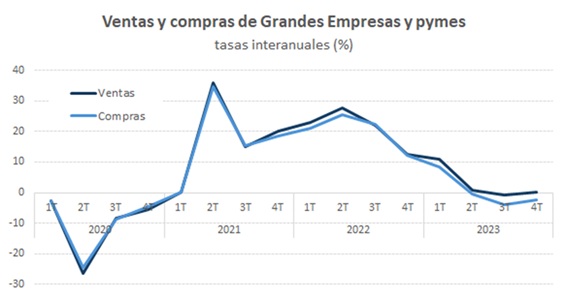
This joint evolution indicates that, at the same time as a higher cost was being borne, relative prices were being reconfigured. This type of analysis, with a more structural content, and the study of the effects that the price increase ultimately had in 2022 and subsequent years can be done both with the Business Margin Observatory, as with the rest of Statistics that leverage information from business accountsthat are offered on the AEAT website.