The economic situation of the first quarter in tax statistics
The tax statistics that have been published in recent weeks close the data for the first quarter of the year and allow us to make an initial assessment of the evolution of the economy in that period. The set of graphs accompanying these lines illustrate the main results.
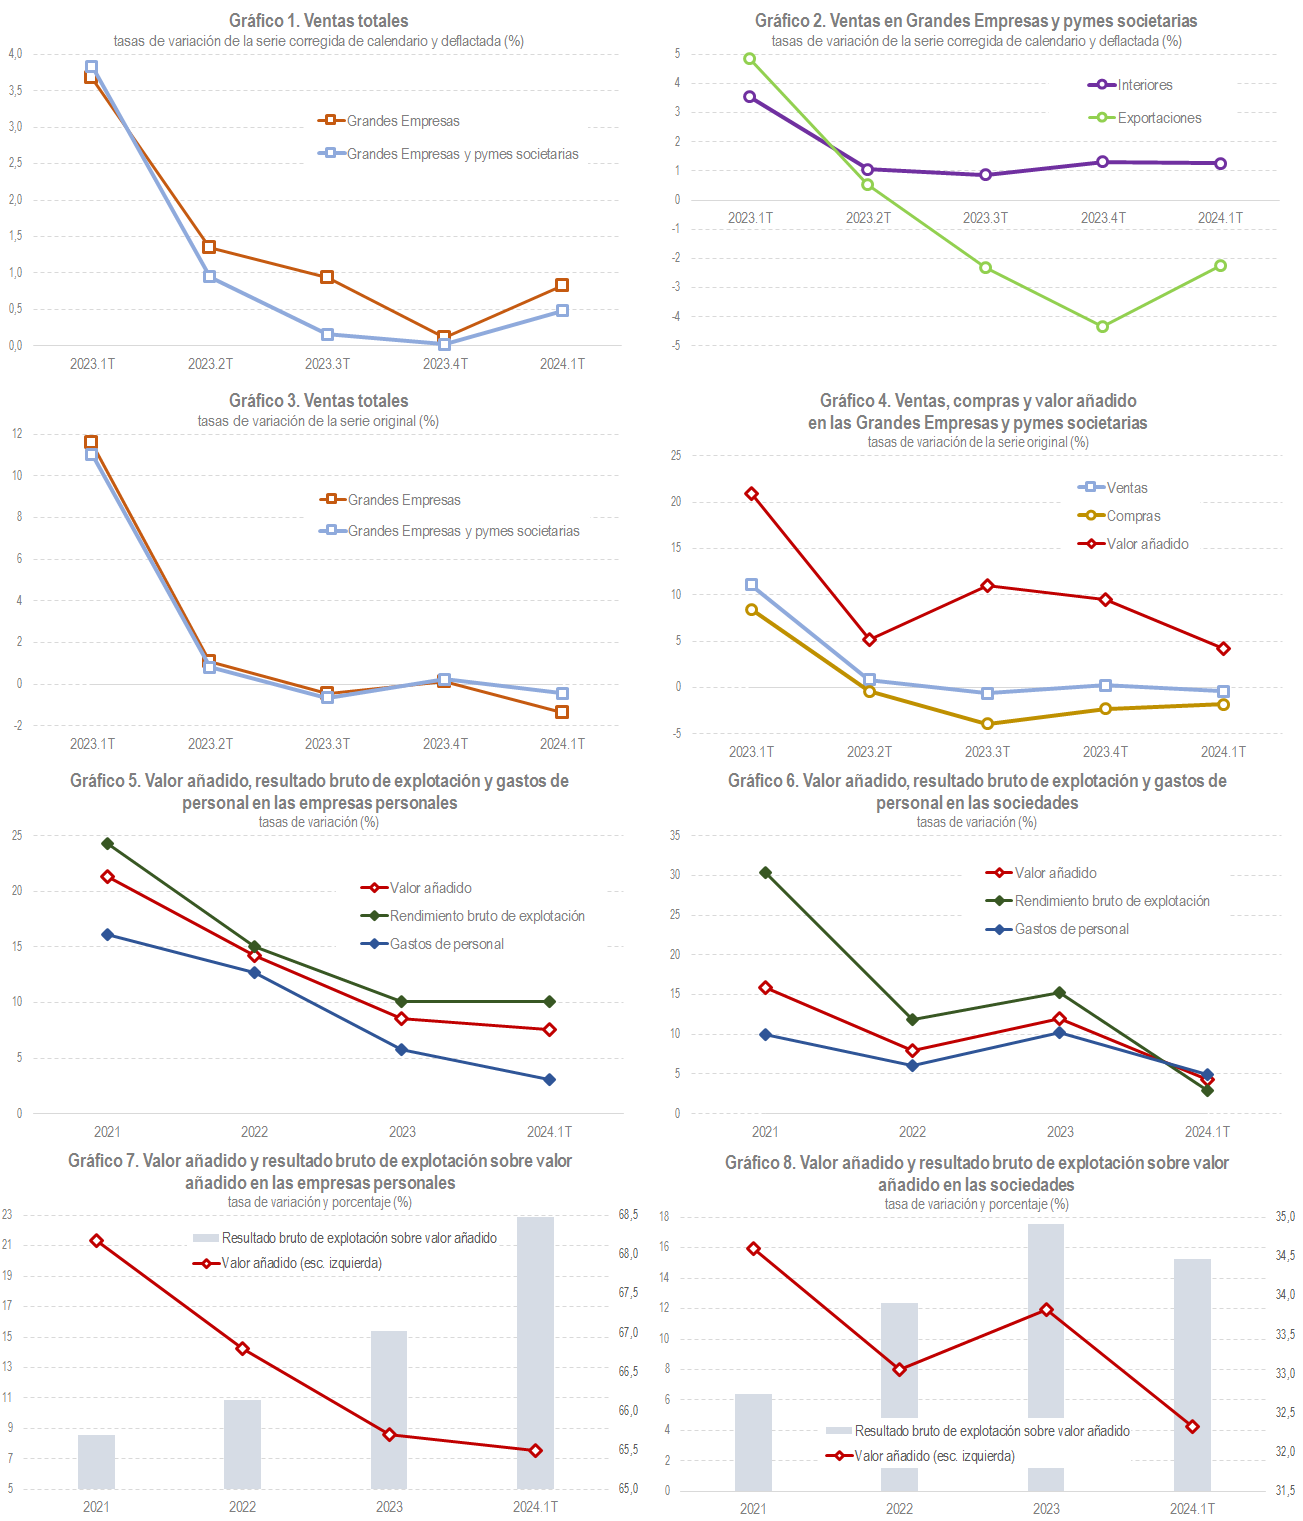
The most novel and notable feature of the recent situation is the rebound in real activity that occurred during the first quarter. As can be seen in Chart 1, which shows the results of the monthly report on sales, employment and wages of Large Companies and the quarterly report on sales, employment and wages of Large Companies and corporate SMEs , sales in real terms grew in said quarter in contrast to the slowing trend they had shown throughout 2023. There were already signs of this rebound in the data that became known at the end of that year thanks to the weekly notes that report on the evolution of daily sales in companies covered by the VAT Immediate Information System (SII). The improvement could also be seen in the new statistics ( Advance of Domestic Sales in Large Companies and SMEs ) which also uses information from the SII, but now with the added perspective of the companies that buy or sell to those companies. In this way, the group for which information is available is expanded from the approximately 75,000 companies included in the SII to the entire population, thereby gaining a high-frequency, high-coverage leading indicator, and also with representation from all sectors, including those in which there is a greater presence of SMEs.
As can be seen in Chart 2, the improvement in real activity is related to the lower losses observed in exports in the first quarter. Domestic sales had been recovering in the final stretch of last year, but exports were still in a very negative phase that lasted almost from the first months of the year. In the first quarter, exports continued to lose ground compared to last year, but at a slower pace, which, together with a certain stabilization of domestic sales, allowed the final result in total sales to be as discussed.
At the same time as the rebound in real terms occurred, price tensions continued to ease. Chart 4, which plots year-over-year rates of total sales in nominal terms, shows the drastic slowdown that occurred in the second quarter of 2023 (note that while Charts 1 and 2 have a similar profile, the first quarter rates are very different). For the rest of 2023 and the beginning of 2024, with some prices falling (particularly energy prices), nominal sales growth was around zero. As pointed out in a previous entry of this newsletter in which the end of 2023 was discussed, this meager sales result may lead to an error in the interpretation of the situation or it may seem paradoxical that income continues to grow at a good pace (up to March 7.5%; see the Monthly Tax Collection Report ) with such small sales increases. The contradiction is explained when one takes into account the simultaneous decline in purchases. Chart 4 shows the two developments, sales and purchases, and their difference, the added value. As can be seen, although sales have shown virtually no increase compared to the same quarter last year, added value has, slightly above 4%. The trend, indeed, is also one of progressive moderation, always in nominal terms, but the rate is already closer to the growth rate of demand and domestic consumption in these early stages of 2024.
The panorama is completed with the information published in the Business Margins Observatory . The data provided on this portal allow us to analyse the evolution of added value and its breakdown into personnel costs and gross operating profit, by different types of companies (companies and personal companies in objective estimation), by activities or by various measures (margin with respect to sales or with respect to added value). Charts 5 to 8 summarize the most notable results.