Daily Inside Sales Flash
Since the implementation of the Immediate Supply of Information (SII) system for VAT in mid-2017, the daily sales data it provides has become a key element in monitoring the economic situation within the overall context. economic information that the Tax Agency offers in this regard. They were a fundamental element in the darkest moments of the lockdown, when classic statistics could not offer answers, but also in the daily monitoring of week-by-week activity or in the analysis of specific episodes that required the existence of immediate data to understand what was happening. This happened, for example, with the transport strike, the DANA, or the blackout.
To the SII There are approximately 70,000 companies registered, which at first glance seems like a small number, but it should be noted that the sales of these companies, the largest in the country, account for more than two-thirds of the total revenue of all companies filing tax returns. VAT. Furthermore, many of them sell directly to a large number of end consumers (think of electricity and communications companies) and all of them are related to many other small and medium-sized enterprises, so that indicators can be developed that give an idea of the evolution of consumption of certain products or of the situation of companies not included in the SII (see in this regard the Advances in Internal Sales in Large Companies and SMEs).
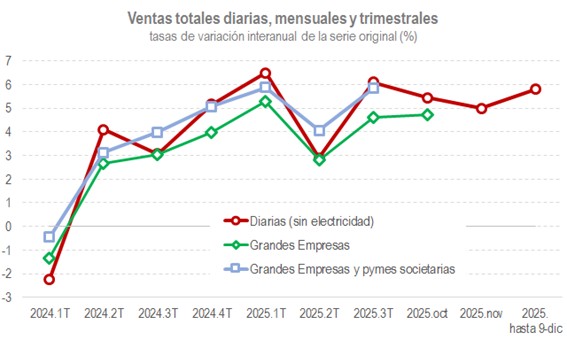
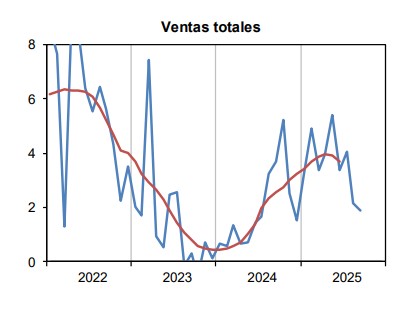
The great advantage of indicators developed with daily information is their closeness to the most recent evolution of activity. But, in return, we have to deal with the enormous irregularity of the data. Every indicator has signal and noise, and the higher the frequency of the data, as in the case of daily sales, the greater the effects of the noise. To eliminate this problem, different approaches can be used. The simplest solution is to switch the indicator to a higher frequency, monthly or quarterly. This allows for an early indicator of activity that will later be confirmed with other measures that take longer to become known. An example is shown in the following chart, where daily data serves as a preview of where the indicators might go. monthly and quarterlysales.
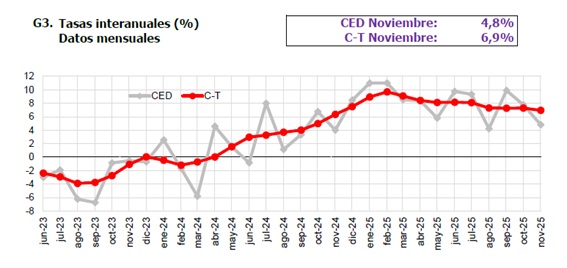
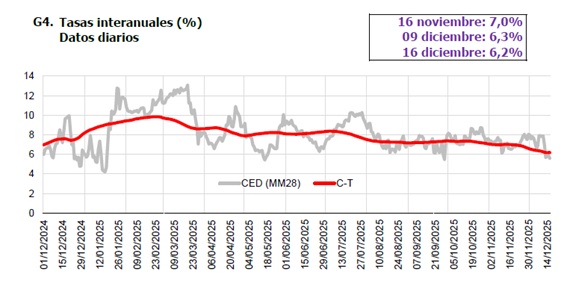
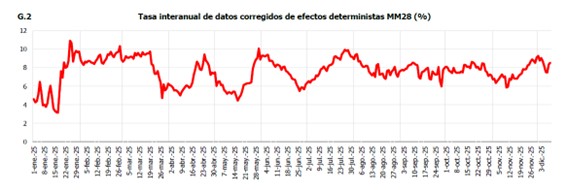
Another way to clean up noise, which is the one used in the publication of weekly report of daily sales, is to look at the 28-day moving average. A clearer view of what is really happening is achieved, avoiding many of the problems arising from the peculiarities of the calendar, which are much greater in this data than in any other frequency. However, with that average, even corrected for deterministic effects, a signal as unequivocal as that obtained in monthly or quarterly series is still not achieved when, using more or less sophisticated statistical techniques, the cycle-trend of the series is calculated. Comparing the two red series in the following two graphs, taken from the weekly daily sales report and the monthly Large Companies report, the difference is evident.
This is the scenario we faced until very recently. However, in recent years there has been a remarkable advance in the knowledge of daily series that has allowed for improvements in data processing techniques to the point that we can now say that we can practically work with daily series in the same way as we used to work with monthly series. This process, in which the Tax Agency participates through the collaboration of its Research Department in various technical forums, is where the publication of the Daily Inside Sales Flash.
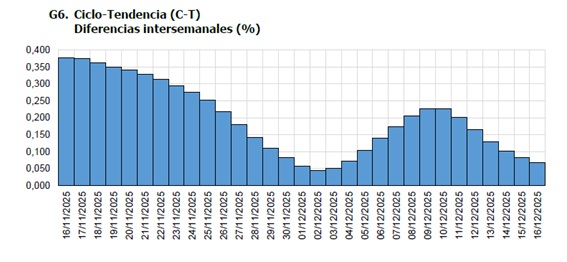
This new report complements the weekly daily sales information with two new features: It has information on domestic sales with a delay of only one week (compared to two weeks for the full weekly report) and the trend signal is estimated. This last one allows for a better visualization of the underlying evolution of sales and makes it possible to calculate very short-term variations (inter-day and inter-weekly differences).
The publication consists of a report that presents the adjustment of the series for the total branches of activity and for the total without the branches of the most volatile behavior (in particular electricity). The adjustment is based on the representation of the unobserved components (trend, seasonality, irregularity) compatible with the model identified and estimated for the observed daily series. This approach is very flexible as it allows the simultaneous consideration of several seasonal components (weekly, monthly and annual) and a representation duly adapted for the presence of fractional frequencies in one or more of the seasonal components (e.g., annual seasonality).
The result of all this is a robust signal of the underlying evolution of domestic sales, as can be seen in the following graphs: